

 So I started thinking about "TYPICAL" actions and possible levels going forward....
What better way than looking at previous "BOTTOMS" and there subsequent moves than with Elliot Wave theory. Note that I removed the 1932-1933 numbers because they skewed the averages with moves of 40%-50%.
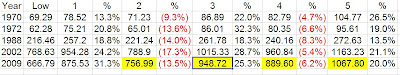 By taking the averages it could look something like the chart below:
 There is only one problem with this.....
Take a look at the percentage move off the current bottom....31.3% in relation to the other First moves....
Nonetheless nothing ever goes straight up or straight down........
No comments:
Post a Comment