

Blog description

- Rodney
- A place for friends to gather and view stock market charts, discuss technical analysis and market outlook. What is your Principal Asset? How can it be developed? Each and all should do their own due dilligence and homework before investing. And by no means should you use anything I say or show here as a sole basis to buy or sell securities as everything is for educational experience only.
Tuesday, November 29, 2011

Friday, November 18, 2011
Monday, November 14, 2011

Thursday, November 10, 2011

Wednesday, November 2, 2011


Tuesday, November 1, 2011
SPY

A break of the 120.75 line will be a major support break of a Monthly Pivot. Tomorrow's action will be very important as a bull push back to the trendline and a gap fill at 125.33 between Wed and Thurs action. But look for the gap fill to be sold hard and this monthly pivot to be in play by Friday if not crushed depending on the news from Greece and Europe.
Monday, October 31, 2011


SPY

Confounding fibonaccis.... 1 penny, really? I think it is pretty clear here a break of 125.33 and or the green trendline would be VERY bearish. I'm considering placing orders to get short below that and inching in long now with a TIGHT stop with thoughts of adding more long above 128.66.
Fun times.
Friday, October 21, 2011

Tuesday, October 18, 2011
Evil Speculator says it best on today's action

Today was an OUTSIDE DAY.
What does that mean? In the simplest terms whenever I see an outside day (or an outside bar of any length) I think
OUTSIDE DAY = LONGS GOT FUCKED AND SHORTS GOT FUCKED
Think about it. Both sides got whipsawed out of their positions. What that means for us is that we have NEW PARTICIPANTS in the market. A trader who took a position today has a different expectancy and tolerance for pain than a long term trend trader, or someone who got in at the lows last week.
The latecomer into the long trade (and the short trade) is by definition a weak hand.
Anything not going his way is going to make him jump to the other side. We have shot to new highs for the last 2 months. Rather than predict whether this is a breakout or a test and fail… lets be objective and let the market tell us how it likes (or hates) these lofty heights.
We have a valid sell signal on break of the daily low, fakeout sell. However statistically outside days are often followed by inside days, before a final breakout. You might consider holding your fire here. Also, statistically outside days most often occur 2-3 days before a market turn.
And statistically setups at the top of a flat bollinger band are higher reliability.
What does this mean? Get out of longs for now, be prepared to get short… and if the short opportunity which almost certainly happens here fails, get long again.
"Late in the session, U.S. stocks and other risk assets received a boost from a Guardian report that Germany and France have agreed to expand the Eurozone bailout fund from 440 billion euros to 2 trillion euros, citing EU diplomats."
Really? How many frickin' times can they play the same card? Oh, I see they played all five at once this time by increasing the previous amount by 5 times. Uhh, wouldn't that indicate that the problem is 5 times bigger? Let's see if it gets done?
Really? How many frickin' times can they play the same card? Oh, I see they played all five at once this time by increasing the previous amount by 5 times. Uhh, wouldn't that indicate that the problem is 5 times bigger? Let's see if it gets done?
Friday, October 14, 2011

Wednesday, October 12, 2011
SPY

Bear pennant STILL intact and isn't it amazing how the fibonacci level was almost pegged. Bottom line is this is a toping tail and price action closed BELOW the trendline.
Just in case cover Puts above 122.87 by evening out with CALLS on a shorter time frame with the mindset of a quick trade.
Tuesday, October 11, 2011
By Robert Schroeder, MarketWatc
WASHINGTON (MarketWatch) — Ratcheting up pressure against a major U.S. trading partner, the Senate on Tuesday approved a bill that would allow new duties on goods from China and other countries that lawmakers say manipulate their currencies.
Overriding objections from some senators and business groups that said the measure would start a trade war with Beijing, the Senate voted 63 to 35 for the bill on Tuesday night.
Action on the measure may stop there, however. House Republican leaders and President Barack Obama have been cool to the bill — a bipartisan measure that its sponsors say would help bring down the 9.1% U.S. unemployment rate.
ECONOMY AND POLITICS | Economy and Politics page
Jobs panel urges help for start-ups
A private-sector board of advisers to the White House is pressing for streamlined regulations and help for start-up businesses, among other recommendations to create more jobs.
• Data reveals some improvement in jobs market
• Economy weathers summer well (First Take)• Report shows need for jobs bill: White House
• Democrats propose 5% tax on millionaires
• Meet the Republican presidential candidates
• Track the latest economic-data reports
• Latest news on the Federal Reserve
• U.S. economic calendar
• Global economic calendar
• Political Watch blog
• Columns: Nutting | Delamaide | Kellner
• Market Snapshot | Bond Report | Currencies
• Sign up for breaking-news alerts by email
The bill instructs the Commerce Department to investigate if any country is subsidizing companies through an artificially low currency, and allows for retaliatory U.S. tariffs.
But the main focus of the bill is China, which lawmakers and the White House long have accused of manipulating the value of its currency, the yuan USDCNY -0.01% , for export advantage.
The Treasury Department has not formally named China a currency manipulator, though, and the Senate bill seeks to act where the administration has not.
China is gradually allowing the value of its currency to rise. Late last month, the People’s Bank of China set the yuan’s midpoint trading range against the U.S. dollar at a new record high of 6.3735.
It’s unlikely that the House will pass the Senate bill as written, but it’s “clearly possible” that the House could pass its own version later, according to Alec Phillips of Goldman Sachs.
“The most likely scenario is that at some point over the next few months, the House will take up a different bill to address the currency issue, but one that does so in a more incremental manner than the Senate’s approach,” Phillips wrote in a note this week.
U.S. manufacturers and the bill’s sponsors say it will stem a decline in American jobs by making U.S. products cheaper overseas.
Obama, meanwhile, readily says that China intervenes in currency markets but also says that any measure targeting China must be consistent with world trade rules. The White House hasn’t yet issued an official policy statement about the bill
-------------------------------------------------------------------------------------------------------------------------------
This is me talking:
What?
"U.S. manufacturers and the bill’s sponsors say it will stem a decline in American jobs by making U.S. products cheaper overseas.
WTF? A DECLINE? in American jobs by making products "Cheaper" overseas? Really, I thought if you make a quality product and are the low cost provider itwould DRIVE DEMAND not lessen it.
What representative sponsoring this Bill said it would create a decline in American jobs? That is a representative I will not vote for. Perhaps they got confused and meant to say it would stem a decline in the American unemployment rate to export more goods as the low cost provider to countries who are UNFAIRLY inflate their currency?Folks, bottom line is this is the beginning of the end when you start poking your biggest creditor and saying, "Hey, dude your money is too expensive". Laughable!
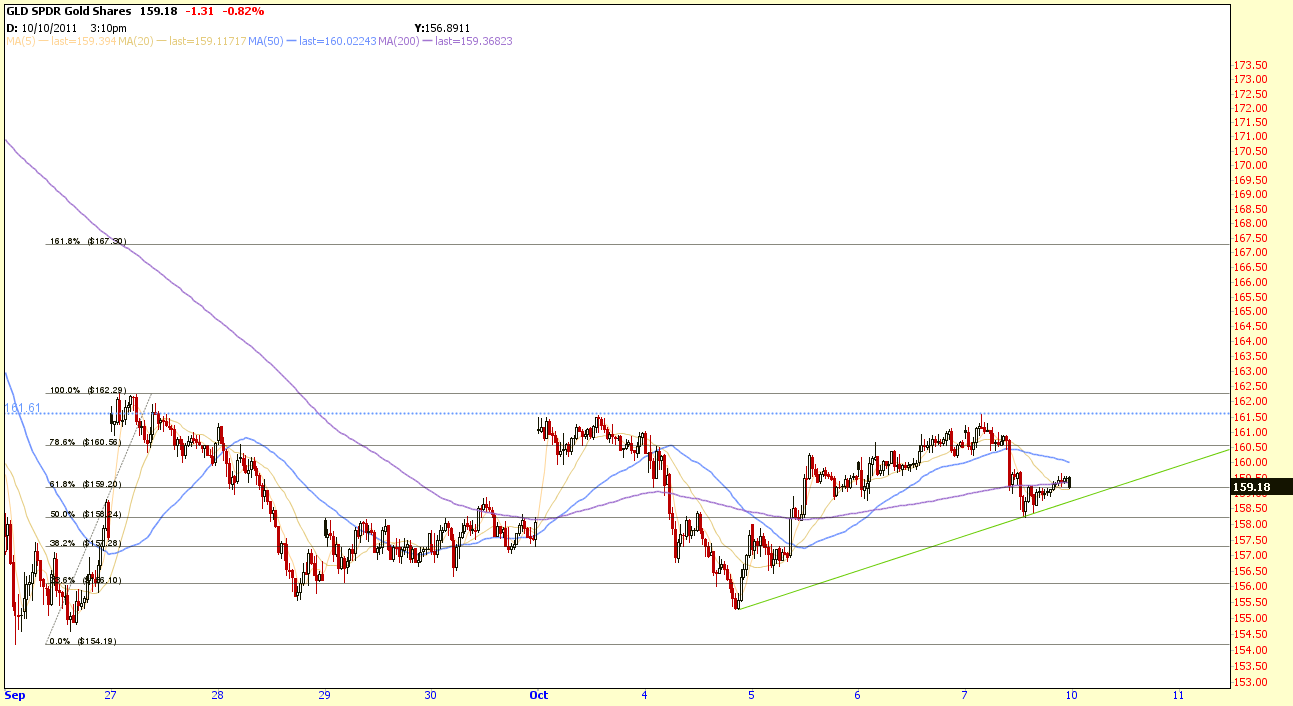
GLD

Test of the $161.61 level.
This is merely a test of the top of the inverted pennant. Notice the gap up from 159.56 was not quickly filled.
Patience with the calls.
Stop below the green trendline.

AA - misses consenus.

"There's a bigger decline in price so far in the 4th Quarter and seasonally it's worse" as reported by Reuters on Aluminum prices.
The actual numbers are almost double for the same quarter from last year and they site "fear" of Europe driving the lack of demand impacting auto, industrial, construction, & packaging industries as most aversely affected. Whereas aerospace & transportation sectors have shown demand and growth.
After hours quote is below $9.63.
I always watch Alcoa's earnigs as they kick of the earnings reporting and Aluminum is widely used acoss industries.
It will be interesting to see f this begins the next leg down.
Monday, October 10, 2011
DPM - ?

Who are these guys?
DCP Midstream Partners, LP is a midstream master limited partnership formed by DCP Midstream, LLC to own, operate, and continue to broaden our portfolio of complementary midstream assets. The Partnership gathers, treats, processes, transports, and markets natural gas and natural gas liquids (NGLs) and is a leading wholesale distributor of propane. Supported by our relationship with DCP Midstream, LLC, and its parents, Spectra Energy and ConocoPhillips, our geographically diverse assets, with strong market positions, and our mix of fee-based and substantially hedged commodity-based margins, position the Partnership for the long term.
Who cares? Well their dividend payout ratio ranks extremely high for a $2.53 per annum dividend or 6.50% yield..
Worth checking out...
GLD
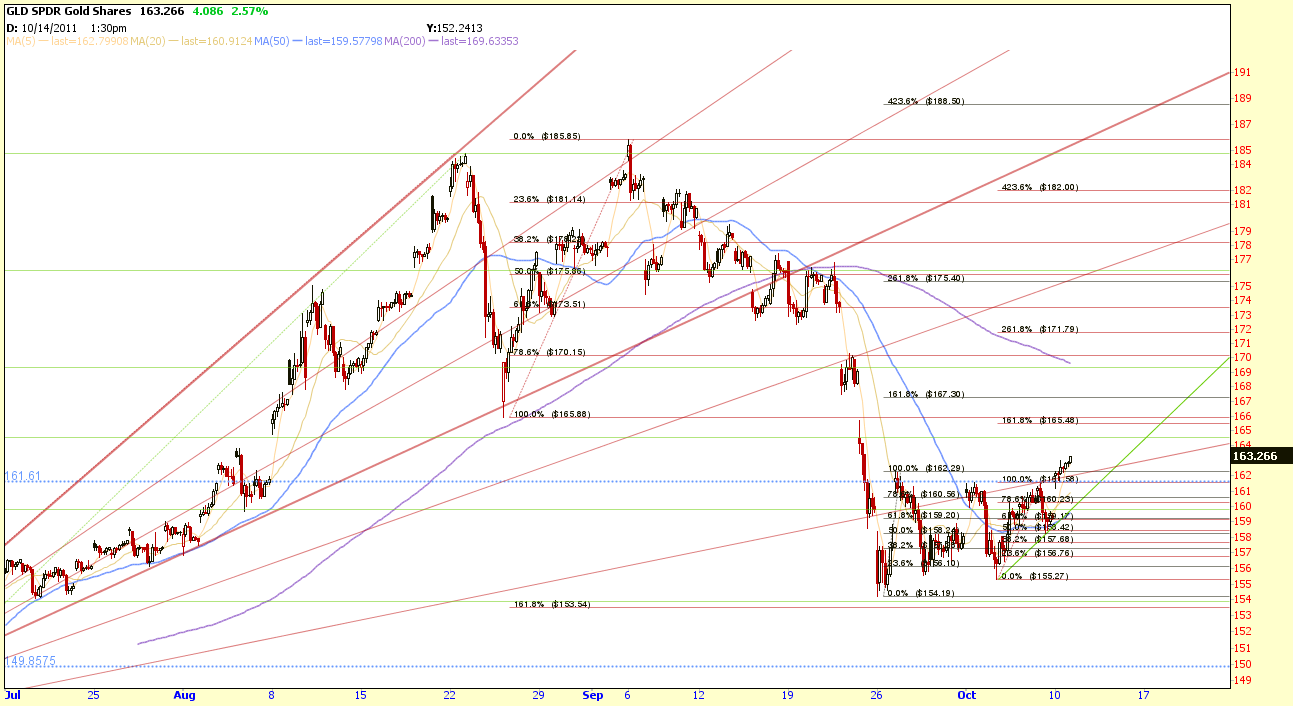
Messy....but if Europe bailout drove market up; what drove Gold up wth it? Very fishy.
Bottom line is the Bear flag on the SPY is STILL intact and the Bear flag on GLD was broken today.
ie, Long GLD and short SPY

Sunday, October 9, 2011

Tuesday, October 4, 2011


Monday, October 3, 2011
SPY

It's just too frickin easy. Now tomorrow's news will have some kind of miraculous solving of the Greece bailout and a bounce back to 113.25
Thursday, September 29, 2011

Tuesday, September 27, 2011
NFLX - PLUNGE

I vaguely recall someone (BRUNO) making this call in early July. I can only hope he actually traded on it and made some double coin in less than 3 months.


SPY - Bear/Bull tug-o-war

Well so far so good on the plan of shorting more about the green trendline. Today's action opened gapping up through the gap down of 9/22 but failed to penetrate the top side of the pennant. So BEAR FLAG still intact.
I'm not getting long until I see a print of 122.88 and those Call orders are already placed.
Monday, September 26, 2011

MO winthin .07 of Gap fill

Start nibbling on those PUTS to protect the Dividend yielding Monster shares. The green trendlines are the trading range.
GLD

Bought a fewCalls at the open on a hunch and plan on setttin a trailing stop above 159.80 to lock the profits in.
SPY - Gap fill within .04

Momentum may carry higher to the underside of the green trendline. However, my Puts were filled and I'll double up if that happens.
Sunday, September 25, 2011
SPY - 2yr weekly

Fibonacci drawn off of Bearish Harami signal from 12/20/2010 to May top. Next leg down to 100.20.
Football analogy to technical analysis provided by Stockcharts
Bulls Versus Bears
A candlestick depicts the battle between Bulls (buyers) and Bears (sellers) over a given period of time. An analogy to this battle can be made between two football teams, which we can also call the Bulls and the Bears. The bottom (intra-session low) of the candlestick represents a touchdown for the Bears and the top (intra-session high) a touchdown for the Bulls. The closer the close is to the high, the closer the Bulls are to a touchdown. The closer the close is to the low, the closer the Bears are to a touchdown. While there are many variations, I have narrowed the field to 6 types of games (or candlesticks):

- Long white candlesticks indicate that the Bulls controlled the ball (trading) for most of the game.
- Long black candlesticks indicate that the Bears controlled the ball (trading) for most of the game.
- Small candlesticks indicate that neither team could move the ball and prices finished about where they started.
- A long lower shadow indicates that the Bears controlled the ball for part of the game, but lost control by the end and the Bulls made an impressive comeback.
- A long upper shadow indicates that the Bulls controlled the ball for part of the game, but lost control by the end and the Bears made an impressive comeback.
- A long upper and lower shadow indicates that the both the Bears and the Bulls had their moments during the game, but neither could put the other away, resulting in a standoff.
Friday, September 23, 2011
SPY = Inside day

Friday's action was inside Thursday's High & low and subsequently somewhat of a non-event. Could fall from here next week or provide an awesome short opportuntity if the gap is filled back to 116.44.

Thursday, September 22, 2011


Wednesday, September 21, 2011


Saturday, September 17, 2011

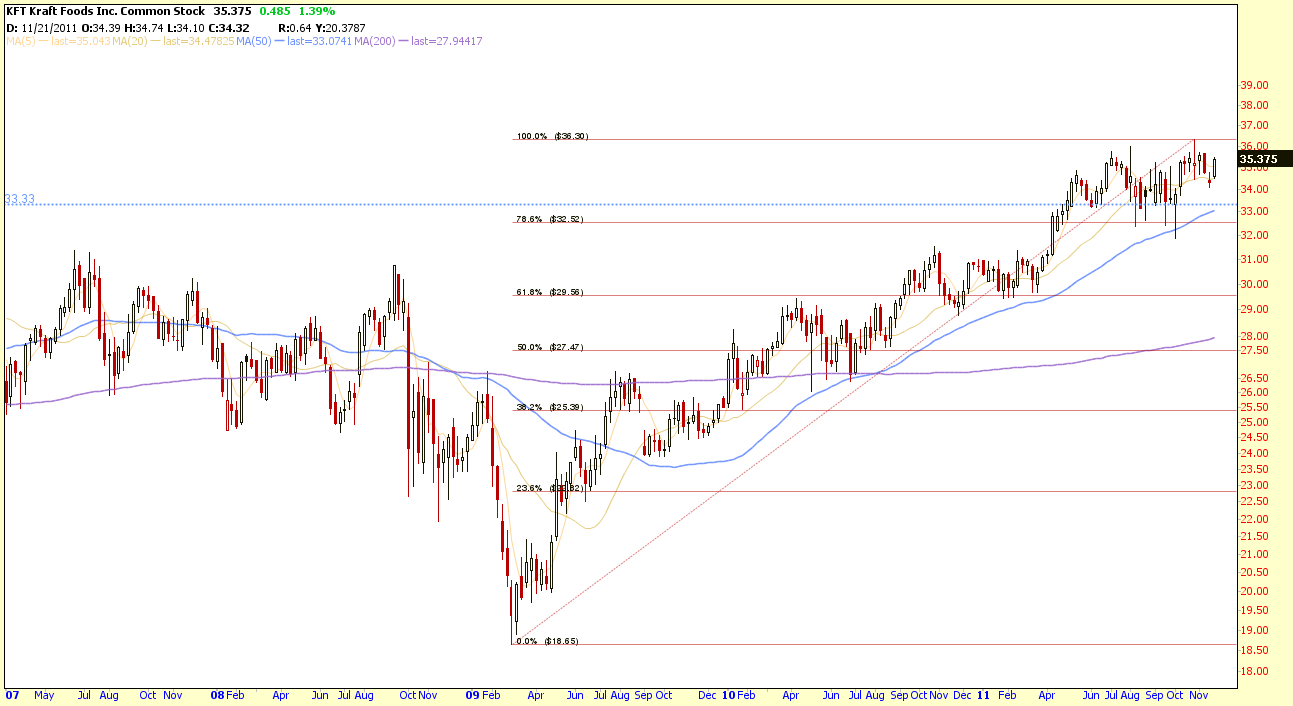
VZ - Weekly Cup with handle

Huge move this past week off of the 50 week SMA @ 34.85. Long above 33.65.


Subscribe to:
Posts (Atom)