Blog description

My photo
A place for friends to gather and view stock market charts, discuss technical analysis and market outlook. What is your Principal Asset? How can it be developed? Each and all should do their own due dilligence and homework before investing. And by no means should you use anything I say or show here as a sole basis to buy or sell securities as everything is for educational experience only.

Friday, November 21, 2008

Divididend yield scan....

Okay, so heres the scan criteria:

Price >= $5
Price <= $100
Average Daily Volume >= 250,000 shares
Dividend Yield >= 10%
Price/Earnings Ratio >= 8


Here are the charts in the above order. All are monthly going back as far as the companies inception thus giving you an idea of how established they are as well as a quick eyeball of previous performance. It is pretty interesting how diverse this group is. It is also particularly interesting how many real estate oriented companies are in this list.

Anyway, I thought you would find this info helpful and enlightening setting up for some long term purchases. My plan is to glean out at least 5 of these.

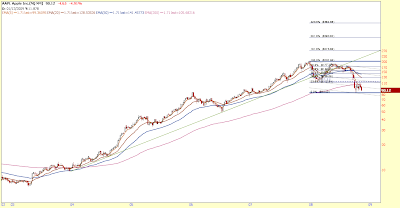
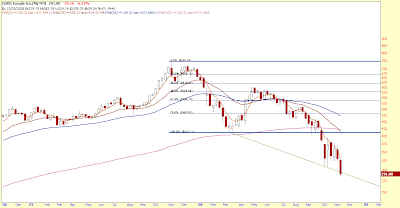
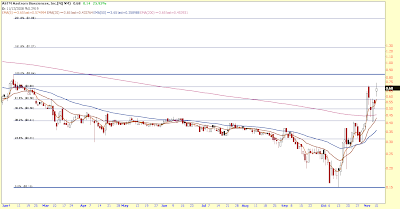
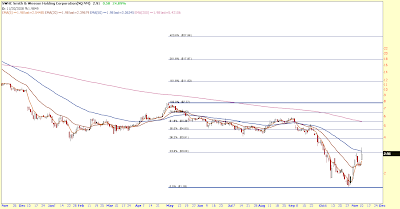
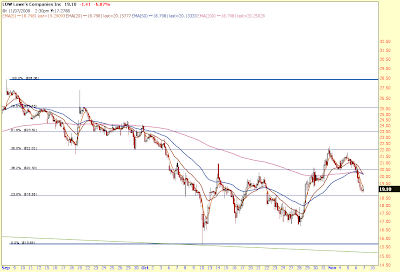
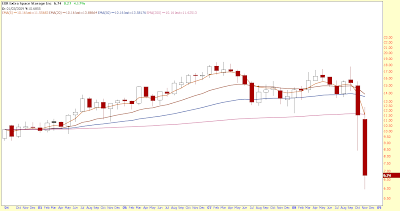
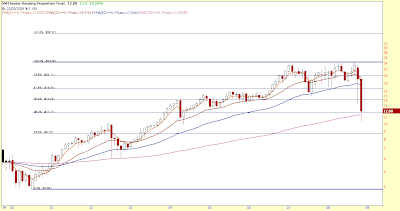
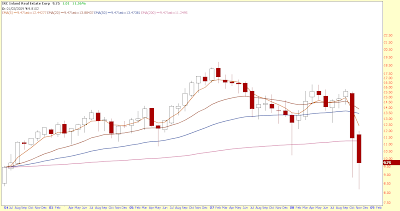
Currently without even doing perfunctionary research I like: BAC, SNH, ADSK, NAT, CRY, NNN, PPL, OHI. This group alone covers Electric power, banking, software, biotech, healthcare, commercial retail space real estate, senior assisted living real estate, & tanker cargo shipping.


The bottom-line is "IF" these companies can keep their dividend intact with earnings power they "COULD BE" some of the biggest and fastest to recover. Otherwise I have a nice used John Deere you may be interested in......

Tuesday, November 18, 2008

Is this the bottom for commodities?

DBC

DBC is an ETF following overall commodities. Will price levels bounce from here, pause to make a bear flag, or just blast through to make new multi-month lows? I'm looking at scenario #2....Shorterm bullish and looking for a short entry.

Wednesday, November 12, 2008

Tech getting creamed....


That's a lot of white space to find support....

Tuesday, November 11, 2008

MR. Softy....

Long term monthly chart of MSFT... Check out all the white space below $17.13...
5 year monthly.... MASSIVE H&S pattern

5 Yr Weekly

What can be reasonably predicted from the above?
  1. At $20.71 there is some extreme support which is weakening with each failed attempt to break below. A break would fulfill the H&S pattern and a projected target below would be $36.95-$20.71 = $16.24.
  2. Another bounce off of $20.71 which will ultimately fail at the 23.6% fib line or $24.54 and then finally break the $20.71 level.

    Either way Mr. Softy will eventually provide a nice short opportunity

Monday, November 10, 2008

Sunday, November 9, 2008

10 day 10 minute graphs...

IWM
S&P 500

The lines in the sand are drawn on these 10 day 10min graphs. If they hold the bull run begins in earnest. Fail and new depths will be found.


Thursday, November 6, 2008

Wednesday, November 5, 2008

OIL and alternative....

OIL CS1700 10 YR Montly
OIL CS1700 daily

FSLR
Oil could be turning higher with support at $55.50. I find it interesting that FSLR looks like a good short with a stop at the 0% fib line.