Hit this link to View Communications grid
Notice anything peculiar?

Blog description

- Rodney
- A place for friends to gather and view stock market charts, discuss technical analysis and market outlook. What is your Principal Asset? How can it be developed? Each and all should do their own due dilligence and homework before investing. And by no means should you use anything I say or show here as a sole basis to buy or sell securities as everything is for educational experience only.
Friday, February 21, 2014


SPY - 185 resistance

Crazy long above 184.95. Otherwise consolodation is in order.
Created with ProphetCharts®
Tuesday, February 18, 2014

Tuesday, February 11, 2014
Friday, February 7, 2014

Thursday, February 6, 2014
$SPX - 60 day 60 min bar

A break above today's high will begin the move to 1795. However, a failure to break today's high will test the 1750 level. should be an interesting day.
Created with ProphetCharts®
$SPX

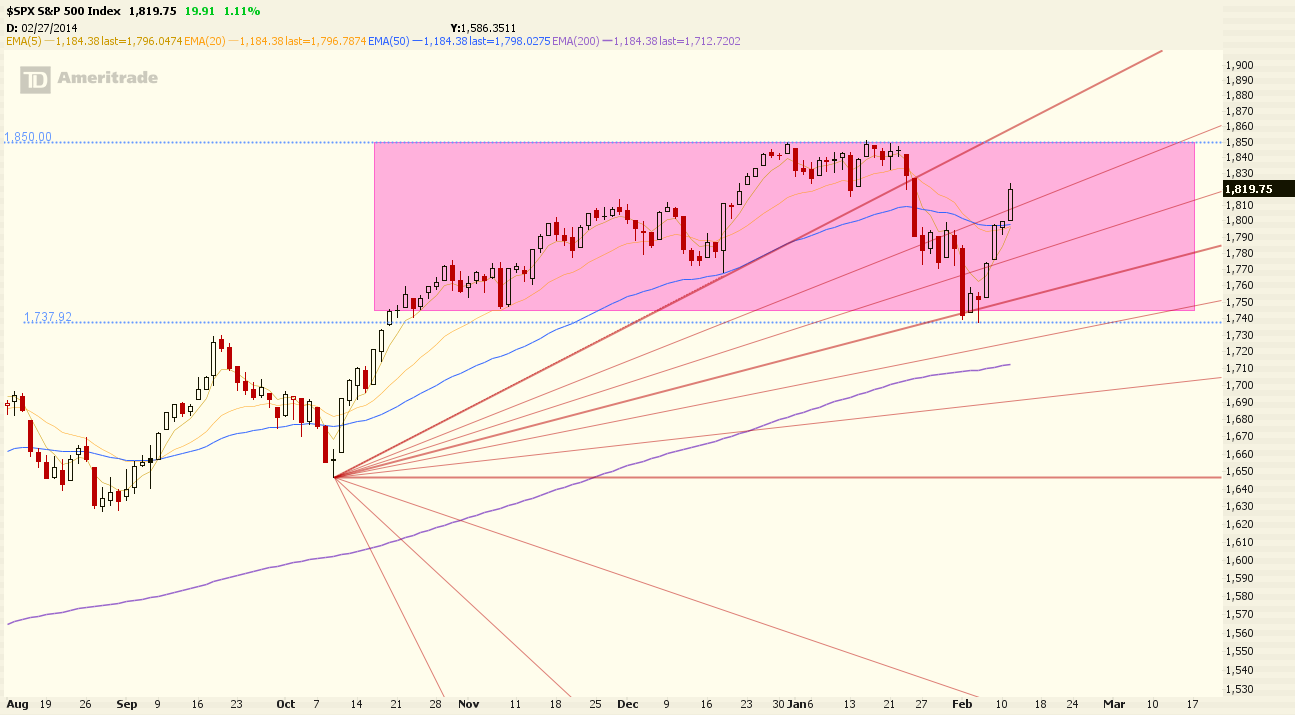
There is little support and a lot of white space between the current level and the 200 Day EMA Purple line. Bottom line is if the market cannot hold the low of yesterday 1737.92 it could get very ugly. Expect a bounce rally on Thursday and take the opportunity to lessen positions and sell into whatever strength there may be. Neutaral is a great position to be in till a discernable trend is established.
Created with ProphetCharts®
$SPX

There is little support and a lot of white space between the current level and the 200 Day EMA Purple line. Bottom line is if the market cannot hold the low of yesterday 1737.92 it could get very ugly. Expect a bounce rally on Thursday and take the opportunity to lessen positions and sell into whatever strength there may be. Neutaral is a great position to be in till a discernable trend is established.
Created with ProphetCharts®
Wednesday, February 5, 2014
Monday, February 3, 2014
Altria Acquires E-Cig Maker Green Smoke for $110M
Marlboro maker Altria Group Inc. says it is buying electronic cigarette company Green Smoke Inc. for about $110 million.
The Richmond, Va.-based owner of Philip Morris USA said Monday that the transaction is expected to close in the second quarter.
The deal with Altria's Nu Mark subsidiary also includes up to $20 million in incentive payments.
Altria began test marketing its own electronic cigarette under the MarkTen brand in August.
The company says Green Smoke's experience in the category, along with its supply chain, products and customer service, will complement its business.
Green Smoke was founded in 2008 and has operations in the U.S. and Israel. Its revenue in 2013 was about $40 million.
$SPX

Using Fibonacci Fans we can see a "swingout" method in lieu of parrallel trends. It still amazes me how price seems to gravitate to Fibonacci and Pivot levels.
Created with ProphetCharts®
Sunday, February 2, 2014
Bruno responds with some insightful information
Mo..... Finally a quarter that missed street estimates - by a penny....
I find it interesting that total cig revenue continues to decline but mo grew market share of Marlboro brand.... Smokeless declining volume is a bigger concern but as I read more the point was made a lot of smokeless products are used outdoors... Construction types, athletics think softball.... Etc.... With the winter we are having who is going outside to smoke or dip... Wine business good but is a small part.... SAB Miller shares continue to provide diversification and cash....restructured long term debt from 4.3 to 3.6 billion by better interest rates. Company continues cost cutting structure. So going forward????? What does the crystal ball say???
E cigs and new "warming" products (pmi testing overseas) will tell the short term tale...
Sab miller shares are on the balance sheet for 6 billion. They are worth 18-20 billion at current market conditions....what could you buy for 18 billion dollars???? Or be debt free and generate a couple of billion dollars a year in cash??? Or send your shareholders a one time dividend of $10.00 PER share!!! Don't hit the sell button just yet...so while your sipping a cold one and thinking, make sure it's a sab/miller product! My dividends thank you!!
I find it interesting that total cig revenue continues to decline but mo grew market share of Marlboro brand.... Smokeless declining volume is a bigger concern but as I read more the point was made a lot of smokeless products are used outdoors... Construction types, athletics think softball.... Etc.... With the winter we are having who is going outside to smoke or dip... Wine business good but is a small part.... SAB Miller shares continue to provide diversification and cash....restructured long term debt from 4.3 to 3.6 billion by better interest rates. Company continues cost cutting structure. So going forward????? What does the crystal ball say???
E cigs and new "warming" products (pmi testing overseas) will tell the short term tale...
Sab miller shares are on the balance sheet for 6 billion. They are worth 18-20 billion at current market conditions....what could you buy for 18 billion dollars???? Or be debt free and generate a couple of billion dollars a year in cash??? Or send your shareholders a one time dividend of $10.00 PER share!!! Don't hit the sell button just yet...so while your sipping a cold one and thinking, make sure it's a sab/miller product! My dividends thank you!!
MO Flexible grid
Flexible Grid with Pivots link
Well it appears that MO missed analysts estimate and reported a 56% drop in revenue on low cigarette volume and a debt repayment.
The Pivot levels:
Daily: Bullish
R3 = 37.42
R2 = 36.22
R1 = 35.72
PIVOT = 35.02
S1 = 34.52
S2 = 33.82
S3 = 32.62
Weekly: Bearish
R2 = 38.61
R1 = 36.91
PIVOT = 35.62
S1 = 33.92
S2 = 32.63
Well it appears that MO missed analysts estimate and reported a 56% drop in revenue on low cigarette volume and a debt repayment.
The Pivot levels:
Daily: Bullish
R3 = 37.42
R2 = 36.22
R1 = 35.72
PIVOT = 35.02
S1 = 34.52
S2 = 33.82
S3 = 32.62
Weekly: Bearish
R2 = 38.61
R1 = 36.91
PIVOT = 35.62
S1 = 33.92
S2 = 32.63
Monthly: Bearish to neutral
R2 = 40.03
R1 =37.62
PIVOT =36.18
S1 = 33.57
S2 = 31.93
With a Friday closing price of 35.22, the 200 day EMA at 35.39, the Daily Pivot at 35.02, and Daily R1 at 35.72 Monday should be a telling day as to how MO is going to recover or not from this News and subsequent sell off. No doubt there are several setups for trading MO regardless of your investing or trading time frame.
R1 =37.62
PIVOT =36.18
S1 = 33.57
S2 = 31.93
With a Friday closing price of 35.22, the 200 day EMA at 35.39, the Daily Pivot at 35.02, and Daily R1 at 35.72 Monday should be a telling day as to how MO is going to recover or not from this News and subsequent sell off. No doubt there are several setups for trading MO regardless of your investing or trading time frame.
MO - 6month Daily

Looking shorter term on a daily bar and inserting a negative Fibonacci retracement we can see some possible trading levels of support and resistance. The major level of resistance is still the 200 day ema purple line at 35.39. Support at 33.80 and 32.26. A way to trade this on the long side would be to place a Buy order above the 200 day EMA of 35.39 as a break above this line will be bullish. Otherwise using this level as a STOP to initiate a short position. Next we'll take a look at the Pivots to see how they match up to these levels.
Created with ProphetCharts®
MO - Lost it's Mojo

Broken trends all over. The most severe break is the 200 day EMA purple line at 35.38 which is now upward resistance. Also there seems to be a year and a half Head & Shoulders pattern forming starting in March of 2013. Left shoulder 6 months, top from August 2013 till January 2014 - 6 months, and right shoulder fromation Yet Tobe Determined. Interesting how the 50% Fibonacci retracement level of this pattern could have given you an excellent price level to play the bounce back to the 200 day EMA. Now that level of 54.29 will act as short term support. If the pattern comes to fruition there could be opportunities to pick up some more MO less than $32. Bottom line is when this pattern fails it will be a VERY Bullish sign.
Created with ProphetCharts®


Thursday, January 30, 2014
GLD - 20 day 30 minute bar with Weekly Pivots
GLD chart
Well GLD and Gold had an interesting day gapping down due to some major banks selling derivatives to China. But here again this is where Pivot levels play such a part in trading. Take a look at the chart above as it speaks for itself on the affinity of the Weekly Pivot S2 level which held as support for today.
Well GLD and Gold had an interesting day gapping down due to some major banks selling derivatives to China. But here again this is where Pivot levels play such a part in trading. Take a look at the chart above as it speaks for itself on the affinity of the Weekly Pivot S2 level which held as support for today.
Tuesday, January 28, 2014
SPY - 1yr Daily

Look for a bounce off lower channel as well as the bottom formation of the Head and Shoulders pattern forming since November at $176.36.
Created with ProphetCharts®
Subscribe to:
Posts (Atom)