Blog description
- Rodney
- A place for friends to gather and view stock market charts, discuss technical analysis and market outlook. What is your Principal Asset? How can it be developed? Each and all should do their own due dilligence and homework before investing. And by no means should you use anything I say or show here as a sole basis to buy or sell securities as everything is for educational experience only.
Friday, February 27, 2009
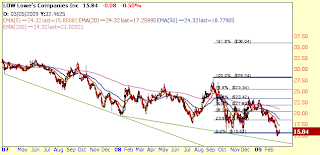
LOW
$12.54 To be exact......that would be the next Fibonacci level down or the 23.6%
For the Web's best interactive charts, please visit http://www.Prophet.Net
LOW
Lowe's looking weaker still.....I see sub $13
For the Web's best interactive charts, please visit http://www.Prophet.Net
HD
Home Depot at tradiable level wiht a very tight stop...
For the Web's best interactive charts, please visit http://www.Prophet.Net
Thursday, February 26, 2009
Crude update
Crude needs to break above the 50 day ema at $44.30 to truly begin formation of the right side of the cup....
For the Web's best interactive charts, please visit http://www.Prophet.Net
SWHC
No big surprise Smith & Wesson is strong since Obama took office, but now may be the time to take profits.....Not a short candidate as if you missed this leg up you could get a chance to "reload" @ $3.00 for the next leg to $4.85.
For the Web's best interactive charts, please visit http://www.Prophet.Net
MET
MET is sporting an ascending triangle and could be a great trading candidate with CALL place tight stop just below $20 and get short now buying PUTS with the stop at $24.50. Using longerterm 6-9 month calls and shorter term 0-3 month PUTs one could play both sides of this and have some insurance in the short term......
For the Web's best interactive charts, please visit http://www.Prophet.Net
JNJ
So much for the advice of buying consumer staples in a downturn. Just anther shining example of why not to PAY someone for their advice and or opinion....
For the Web's best interactive charts, please visit http://www.Prophet.Net
Wednesday, February 25, 2009
Crude to $70.....
"OPEC's leaders, who have said recently that they would like prices to rise to $70, will likely reduce output quotas by at least another 500,000 barrels a day at a meeting on March 15"
As crude turns so will the market. Bernanke's upbeat comments this week regarding the recession ending this year leads me to wonder when the capitualation bottom will occur. Remember the bottom is a process and part of that process is a "washout" where EVERYONE and every headline will scream blood in the streets. When this happens it will be time to buy.....WAIT for the fear index to top out....
As crude turns so will the market. Bernanke's upbeat comments this week regarding the recession ending this year leads me to wonder when the capitualation bottom will occur. Remember the bottom is a process and part of that process is a "washout" where EVERYONE and every headline will scream blood in the streets. When this happens it will be time to buy.....WAIT for the fear index to top out....
Tuesday, February 24, 2009
RIMM
Hmmmm monthly support at $26. How about a staged buy-in strategy for a longer-term holding?
For the Web's best interactive charts, please visit http://www.Prophet.Net
RIMM
Would ya buy RIMM below $36 with a stop @ $35?
Hmmmmmmm..............tempting?????
For the Web's best interactive charts, please visit http://www.Prophet.Net
RIMM
Would ya buy RIMM below $36 with a stop @ $35?
Hmmmmmmm..............tempting?????
For the Web's best interactive charts, please visit http://www.Prophet.Net
AMZN
How's that short working out on Amazon Bruno?.....Not too good......You may have another chance to short around $67. If the recent highs are not taken out look for the gap up in late January to be refilled in the low $50's. But all bets are off if breaks out above $67.36 then look for $80.
For the Web's best interactive charts, please visit http://www.Prophet.Net
Monday, February 23, 2009
XLY
All because no one is spending.........
Consumer Discretionary spending tanking to retest Nov 08' lows...
For the Web's best interactive charts, please visit http://www.Prophet.Net
$RUT
A longer term look at the Russell 2k...
Looks like 316'ish to me....
For the Web's best interactive charts, please visit http://www.Prophet.Net
IWM
IWM looking interesting from a monthly perspective. If this breaks where is the bottom?
For the Web's best interactive charts, please visit http://www.Prophet.Net
$INDU
Hate to say I told ya so, but will it hold here.......
For the Web's best interactive charts, please visit http://www.Prophet.Net
Subscribe to:
Comments (Atom)


