Blog description
- Rodney
- A place for friends to gather and view stock market charts, discuss technical analysis and market outlook. What is your Principal Asset? How can it be developed? Each and all should do their own due dilligence and homework before investing. And by no means should you use anything I say or show here as a sole basis to buy or sell securities as everything is for educational experience only.
Saturday, June 6, 2009
AMD
XLF resistance
What drove the market off March lows was the Financials. However, in May the luster began to wear off and the uptrend was broken now becoming resistance.
S&P - A/B Scenario with a Democratic twist
Scenario A has the Bulls rallying from the Open Monday breaking out of the 880-950 range and the inverted H&S formed over the past 6 months. Month end Target of 1050.
 Market opens lower and solidly back into range of 880-950. Hits 920 in first hour of trading.
Scenario B - Ted Kennedy provides the "Nail" for the Bears to hammer the coffin of the Bull rally:
"Kennedy bill would make employers provide care":
http://www.charter.net/news/read.php?id=15597453&ps=1014&srce=news_class&action=4&lang=en&_LT=HOME_BUNWC00L4_UNEWS Market opens lower and solidly back into range of 880-950. Hits 920 in first hour of trading.
Thursday, June 4, 2009
FSLR
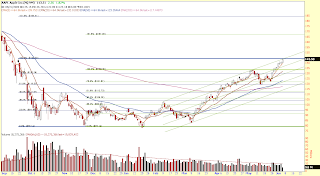
FSLR in a trading quandry of either filling the gap back down to $156.36 or breaking out to test and or blow through highs of $206.18. Either way it is positioned for a 30 point move.
For the Web's best interactive charts, please visit http://www.Prophet.Net
AAPL
A lot of charts looking like AAPL. Is there enough left in the tankd for the BUlls to ram through the resistance or will there be another fade?
For the Web's best interactive charts, please visit http://www.Prophet.Net
Tuesday, June 2, 2009
GG
Goldcorp may provide an entry to get long this week in the low $36.
For the Web's best interactive charts, please visit http://www.Prophet.Net
TOL
Long term chart of Toll Brothers gives a good look of the homebuilders. Does it look like the bottom is in? Which way will it break?
For the Web's best interactive charts, please visit http://www.Prophet.Net
EUR/USD
Seeing a lot of chatter about the Euro being an indicator of the overall market. It too is hitting a possible resistance point at a 50% fib retracement. If the Euro rolls over be sure to look under the hood to see why. Is it because the dollar is stonger? Or perhaps not. Perhaps both currencies could be getting weaker?
For the Web's best interactive charts, please visit http://www.Prophet.Net
XLE
At resistance, but definitely an indicator to be looking to get in Energy related stocks such as UNG, APA, CHK, SLB on any pullback to the 200 day MA.
For the Web's best interactive charts, please visit http://www.Prophet.Net
IWM
Hmmmmm, This sure looks like a blow off top. Look for lack of follow-through Tuesday.
For the Web's best interactive charts, please visit http://www.Prophet.Net
AMZN
Amazon in a quandry....
Long term DESCENDING trend
Ascending triangle broken to upside
Inverted H&S completely formed
Cup with Handle about to breakout above 85.26?
I believe we are bordering on irrational exhuberance; and position sizes should be reduced accordingly.
For the Web's best interactive charts, please visit http://www.Prophet.Net
Subscribe to:
Comments (Atom)


