Blog description
- Rodney
- A place for friends to gather and view stock market charts, discuss technical analysis and market outlook. What is your Principal Asset? How can it be developed? Each and all should do their own due dilligence and homework before investing. And by no means should you use anything I say or show here as a sole basis to buy or sell securities as everything is for educational experience only.
Tuesday, October 11, 2011
AA - misses consenus.
"There's a bigger decline in price so far in the 4th Quarter and seasonally it's worse" as reported by Reuters on Aluminum prices.
The actual numbers are almost double for the same quarter from last year and they site "fear" of Europe driving the lack of demand impacting auto, industrial, construction, & packaging industries as most aversely affected. Whereas aerospace & transportation sectors have shown demand and growth.
After hours quote is below $9.63.
I always watch Alcoa's earnigs as they kick of the earnings reporting and Aluminum is widely used acoss industries.
It will be interesting to see f this begins the next leg down.
Monday, October 10, 2011
DPM - ?
Who are these guys?
DCP Midstream Partners, LP is a midstream master limited partnership formed by DCP Midstream, LLC to own, operate, and continue to broaden our portfolio of complementary midstream assets. The Partnership gathers, treats, processes, transports, and markets natural gas and natural gas liquids (NGLs) and is a leading wholesale distributor of propane. Supported by our relationship with DCP Midstream, LLC, and its parents, Spectra Energy and ConocoPhillips, our geographically diverse assets, with strong market positions, and our mix of fee-based and substantially hedged commodity-based margins, position the Partnership for the long term.
Who cares? Well their dividend payout ratio ranks extremely high for a $2.53 per annum dividend or 6.50% yield..
Worth checking out...
GLD
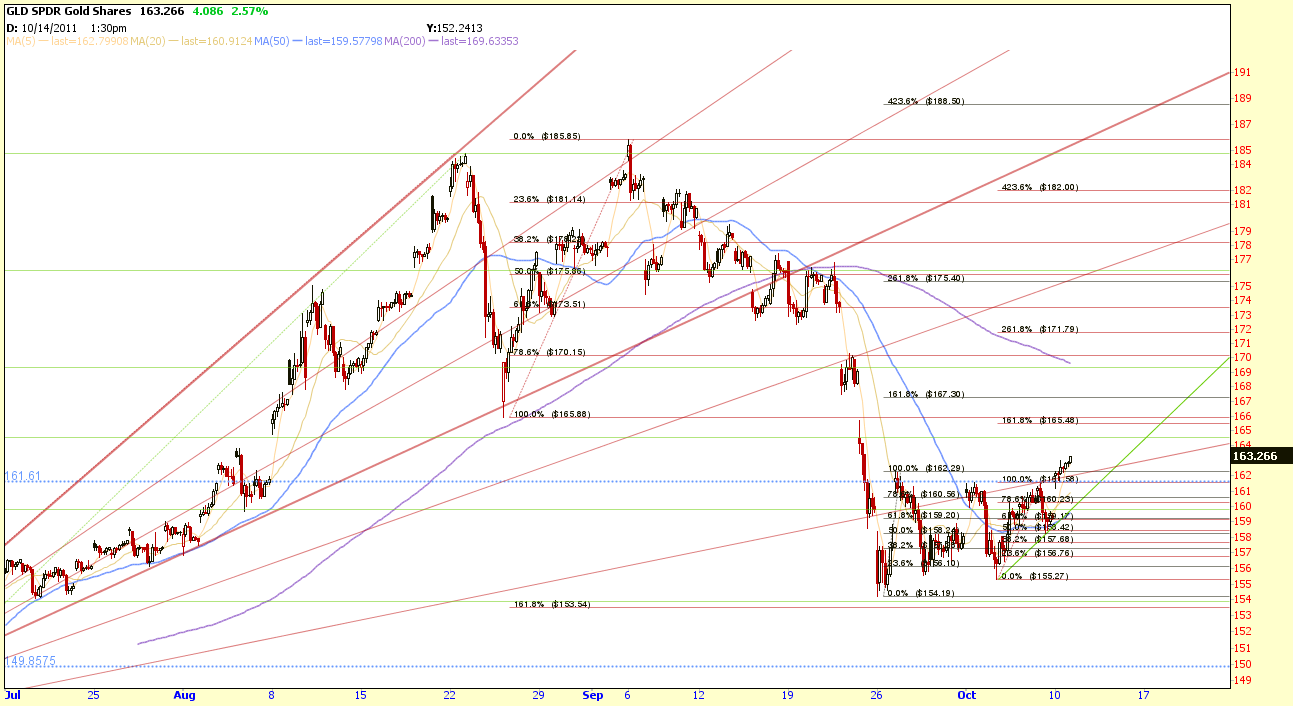
Messy....but if Europe bailout drove market up; what drove Gold up wth it? Very fishy.
Bottom line is the Bear flag on the SPY is STILL intact and the Bear flag on GLD was broken today.
ie, Long GLD and short SPY
Sunday, October 9, 2011
Tuesday, October 4, 2011
Monday, October 3, 2011
SPY
It's just too frickin easy. Now tomorrow's news will have some kind of miraculous solving of the Greece bailout and a bounce back to 113.25
Thursday, September 29, 2011
Tuesday, September 27, 2011
NFLX - PLUNGE
I vaguely recall someone (BRUNO) making this call in early July. I can only hope he actually traded on it and made some double coin in less than 3 months.
SPY - Bear/Bull tug-o-war
Well so far so good on the plan of shorting more about the green trendline. Today's action opened gapping up through the gap down of 9/22 but failed to penetrate the top side of the pennant. So BEAR FLAG still intact.
I'm not getting long until I see a print of 122.88 and those Call orders are already placed.
Monday, September 26, 2011
MO winthin .07 of Gap fill
Start nibbling on those PUTS to protect the Dividend yielding Monster shares. The green trendlines are the trading range.
GLD
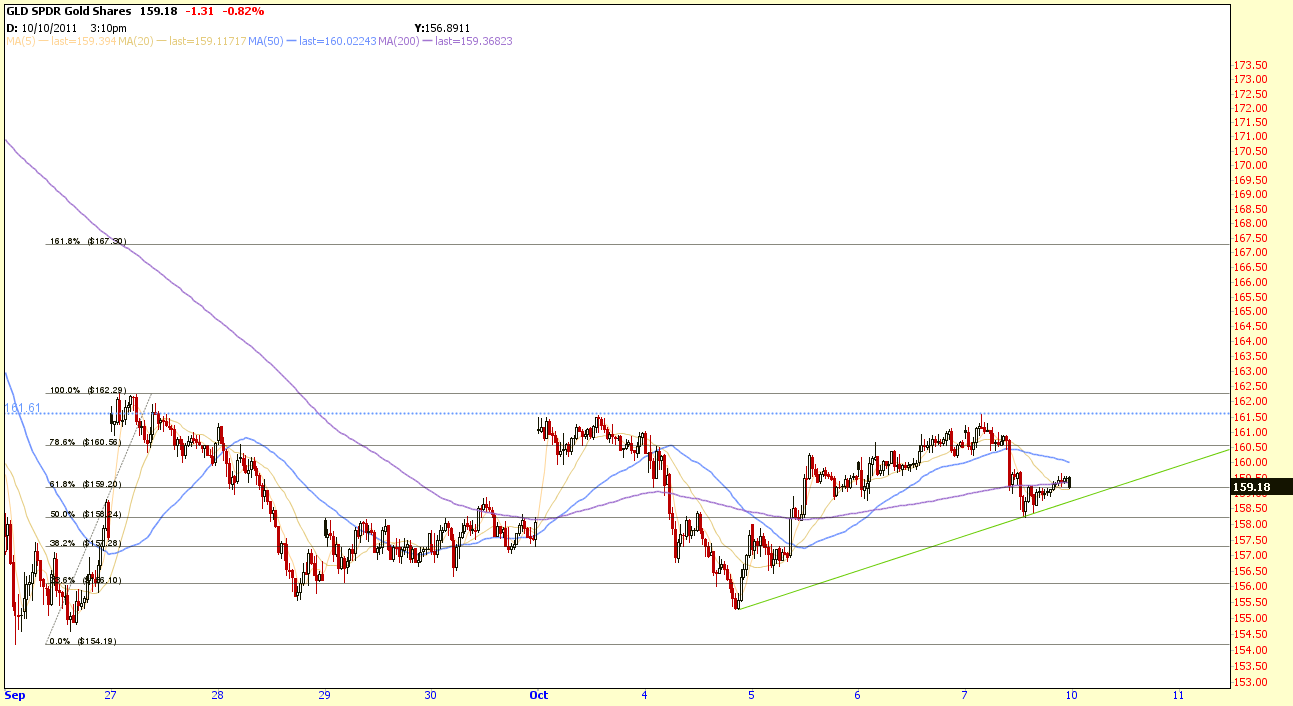
Bought a fewCalls at the open on a hunch and plan on setttin a trailing stop above 159.80 to lock the profits in.
SPY - Gap fill within .04
Momentum may carry higher to the underside of the green trendline. However, my Puts were filled and I'll double up if that happens.
Sunday, September 25, 2011
Football analogy to technical analysis provided by Stockcharts
Bulls Versus Bears
A candlestick depicts the battle between Bulls (buyers) and Bears (sellers) over a given period of time. An analogy to this battle can be made between two football teams, which we can also call the Bulls and the Bears. The bottom (intra-session low) of the candlestick represents a touchdown for the Bears and the top (intra-session high) a touchdown for the Bulls. The closer the close is to the high, the closer the Bulls are to a touchdown. The closer the close is to the low, the closer the Bears are to a touchdown. While there are many variations, I have narrowed the field to 6 types of games (or candlesticks):
- Long white candlesticks indicate that the Bulls controlled the ball (trading) for most of the game.
- Long black candlesticks indicate that the Bears controlled the ball (trading) for most of the game.
- Small candlesticks indicate that neither team could move the ball and prices finished about where they started.
- A long lower shadow indicates that the Bears controlled the ball for part of the game, but lost control by the end and the Bulls made an impressive comeback.
- A long upper shadow indicates that the Bulls controlled the ball for part of the game, but lost control by the end and the Bears made an impressive comeback.
- A long upper and lower shadow indicates that the both the Bears and the Bulls had their moments during the game, but neither could put the other away, resulting in a standoff.
Subscribe to:
Posts (Atom)