A place for friends to gather and view stock market charts, discuss technical analysis and market outlook. What is your Principal Asset? How can it be developed? Each and all should do their own due dilligence and homework before investing. And by no means should you use anything I say or show here as a sole basis to buy or sell securities as everything is for educational experience only.
A candlestick depicts the battle between Bulls (buyers) and Bears (sellers) over a given period of time. An analogy to this battle can be made between two football teams, which we can also call the Bulls and the Bears. The bottom (intra-session low) of the candlestick represents a touchdown for the Bears and the top (intra-session high) a touchdown for the Bulls. The closer the close is to the high, the closer the Bulls are to a touchdown. The closer the close is to the low, the closer the Bears are to a touchdown. While there are many variations, I have narrowed the field to 6 types of games (or candlesticks):
Long white candlesticks indicate that the Bulls controlled the ball (trading) for most of the game.
Long black candlesticks indicate that the Bears controlled the ball (trading) for most of the game.
Small candlesticks indicate that neither team could move the ball and prices finished about where they started.
A long lower shadow indicates that the Bears controlled the ball for part of the game, but lost control by the end and the Bulls made an impressive comeback.
A long upper shadow indicates that the Bulls controlled the ball for part of the game, but lost control by the end and the Bears made an impressive comeback.
A long upper and lower shadow indicates that the both the Bears and the Bulls had their moments during the game, but neither could put the other away, resulting in a standoff.
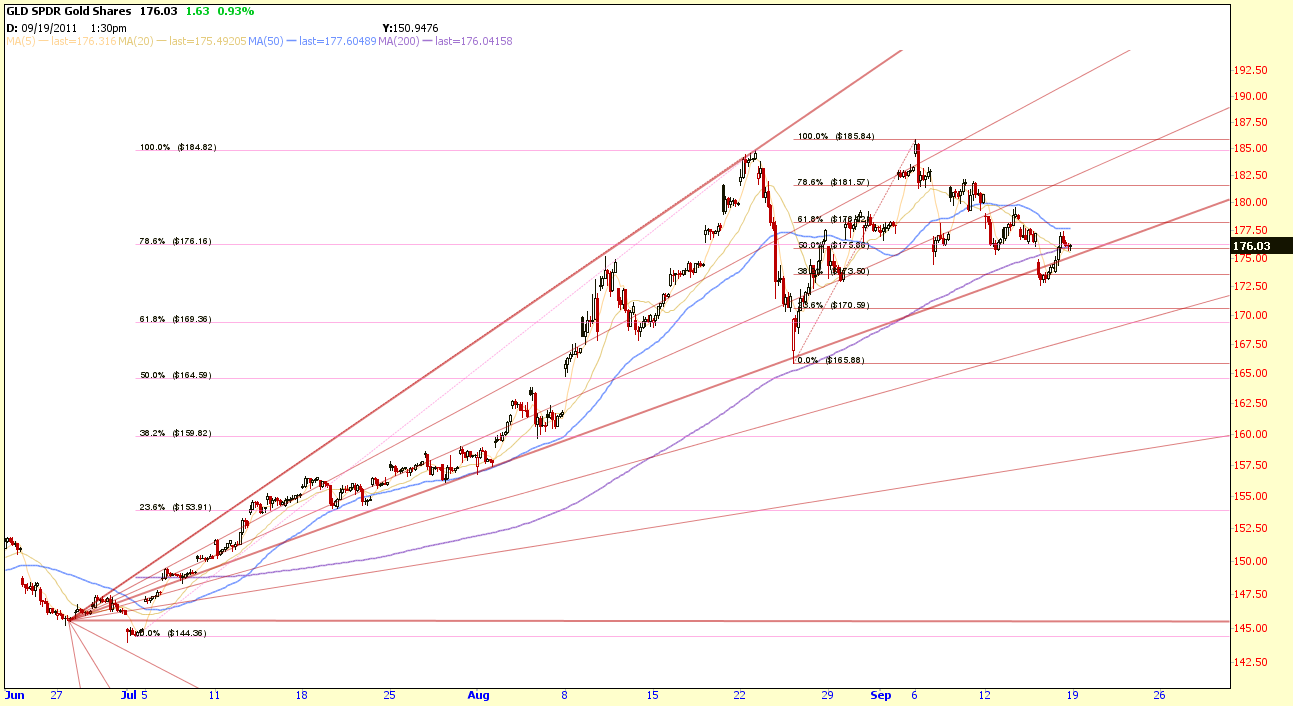
Friday's action was inside Thursday's High & low and subsequently somewhat of a non-event. Could fall from here next week or provide an awesome short opportuntity if the gap is filled back to 116.44.