A place for friends to gather and view stock market charts, discuss technical analysis and market outlook. What is your Principal Asset? How can it be developed? Each and all should do their own due dilligence and homework before investing. And by no means should you use anything I say or show here as a sole basis to buy or sell securities as everything is for educational experience only.
Do those first three charts look exactly like the QQQQ? What about GOOG? Can you say death spiral? The green line is first line of resistance on the bullis side, but I strongly believe any upside move can be shorted with confidence.
The election is tomorrow and I do not expect the market to behave any differently until Obama is declared the winner late Tuesday night. The Wednesday morning futures should be interesting. Until then the market will be a yawn-fest.
So you think the precious metals are going to take off because the Government is going to continue to print money until we are completely in a 1930's type recession? As Billy Joel once said:
Bottom-line here is Bottom fishing may be the new down-rigger necessary sport. Most of the charts look like SWC which could have a "bit" more downside. But at these prices....Do the math.
SWC
The same could be said for the battered home builders. TOLL Brothers has held up nicely in the latest downside barrage. Could it be the best in breed going forward. Let's say 3-5 year leaps?TOL
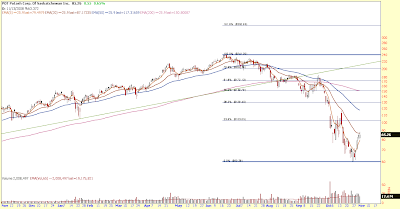
Sometimes its fun to compare two completely opposite stocks like POT and MOS. Potash is best in breed agriculture while Mosaic is primarily a technology advertiser. Wow are these guys and their sectors headed in opposite directions? POT appears to be forming an inverted H&S while MOS could be headed for sub $20 to form a right shoulder of a massive monthly H&S
POT
MOS
And then there is oil. Well oil service has just been murdered, but is now the time to be nibbling? Hmmmmm, could be......
OIH
And here is an interesting gas play...ever heard of Lacede? Pretty strong chart long term and check out the 30 day 30 min for the short term strength. The short term action found resistance and support between long-term fib lines...
LG
LG 30 DAY - 30 MINUTE And lets use oil to segue into China...Petrochina and the FXI may be in the bottom-fish category as well. If oil is going back to $120 I figure these two will follow suit.
PTR
FXI And lastly there is AMZN: inverse H&S going back to highs only to fall hard in the end... Which is really the longer term picture. Bull run for now which will not set new highs in 2009 and then a BRUTAL collapse of markets lasting much longer than 2 months. The government is merely delaying the inevitable and setting those up smart enough to realize you that if you were long and did not get out your second chance awaits over the next 6-9 months and you had better get out and get short prior to the old highs. But till then it is bull season and the trend is your friend.
Altria for the indulgence play is still searching for solid ground. The recent lows will be retested before any confident bull run will take place.
MO
SEE or Sealed Air may be a nice way to play the online retailers and shippers as they are a bubble wrap packaging system manufacturer that also supplies the meat industry with dry-pak packaging of meat products.
SEE
Now Mr. Softy is sporty a fairly significant H&S pattern. The thing is the right shoulder is lower than the left which normally indicates further downside risk. However, the likelihood of $24 hitting before more downside makes the most sense.
MSFT
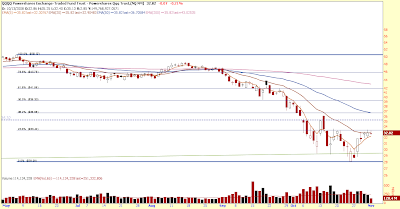
And by looking at the QQQQ monthly more downside after a res bit.
Because nobody else likes them except Cramer........
XHB - The homebuilder ETF is channel down
Cramer was touting Masco several weeks ago just after he called the Bottom. I figure he has to double up here soon...
MAS
Cramer has also been heavy on Nuecor for the dividend yield play. There must be something here because he talked about it for most of last week. Best in Breed going forward? NUE KBR - Balance sheet but at sub $10 could be a deal...
Here are some ways to play oil. Options are available on all and the bid/ask spreads are not terrible.
XLE
USO
SLB
And the VIX closing in on 100 nearly touching the 423.6% fibonacci line. I hope you are writing options if you can because the premiums are unreal.....
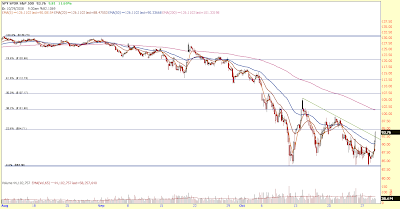
Looking at a 60 min/60 day chart of the SPY one can see the trinangle trading range forming over the last couple of weeks. Normally, a pattern such as this is broken in the direction of the prevailing trend which is still bearish and thus could be termed a "bear flag". If this is the case a likely target for the S&P would be approximately 70.00.
If the triangle is broken counter-trend to the upside the important levels of resistance are the highs along the downward green trendline and then the 200 hour EMA
Here it is on a daily 3 month chart. Note the importance of the 20 day EMA...
Crude is making a strong case for heading back to $65 While agriculture seems to have bottomed and begining to bounce - Here's the ETF - DBA Here is arguably the best in breed - POT which appears to be finding support at the 23.6%fibonacci. And finally the VIX which fell to the 20 day EMA. Tomorrow will be interesting if the bulls have a follow-through day this ema support will be broken...
The QQQQ was the only major indice to post a week engulfing the previous week an thus possibly setting the tone for a bounce of the overall market. However it is a concern that the open and close are centered in the week suggesting major indecision. The bottoming process continues... AMZN backfilled the gap up of early 2007 found support and bounced higher. Looking at a 5 yr weekly and then at a shorter term daily chart a long trade could be placed using last weeks close as a tight stop and the recent low as a loose stop. Bottom line here is AMZN will test the falling 20 day EMA again and if it breaks to the upside........
The VIX has formed a cup with a handle over the last 5 days retracing back to the 61.8% Fibonacci line. Failure will result in the VIX testing the recent lows. The major indices have bounced and made a higher low but are still beneath the 200 EMA. It is interesting how this almost exactly correlates to a fib line on the $INDU. The SPY battled back to the 200 EMA but sold off at the end of the day... And the real battleground in the QQQQ was sold off hard on the close. Oh to be a trader......
When I said a few days ago "the VIX would fall" I did not figure on it falling from the 70's. WOW!!!! It is still amazing how Fibonacci levels come into play even on the VIX. It appears that for the time being the government has put the breaks on the freefall market. It is merely a bouncing ball losing momemtum with each successive bounce......


 AAPL
AAPL