| Symbol | Industry Sector | Last | PE | EPS | Yield | Div |
| POEFF | $ 2.30 | 1.49 | 1.54 | 33.14% | $ 0.76 | |
| PMGLF | $ 6.06 | 5.66 | 1.07 | 8.09% | $ 0.12 | |
| JE | $ 6.78 | 3.60 | 1.88 | 12.19% | $ 0.07 | |
| NYMT | Holding and Other Investment Offices | $ 7.27 | 6.73 | 1.08 | 14.86% | $ 0.27 |
| PDLI | Chemicals and Allied Products | $ 7.35 | 5.07 | 1.45 | 8.16% | $ 0.15 |
| PTSRF | $ 7.73 | 5.77 | 1.34 | 8.13% | $ 0.05 | |
| INTX | Business Services | $ 9.63 | 9.26 | 1.04 | 8.31% | $ 0.20 |
| TICC | Holding and Other Investment Offices | $ 9.68 | 5.60 | 1.73 | 11.98% | $ 0.29 |
| BVPFF | $ 9.90 | 9.54 | 1.04 | 7.30% | $ 0.05 | |
| DX | Holding and Other Investment Offices | $ 10.46 | 7.75 | 1.35 | 11.09% | $ 0.29 |
| KFN | Non-Depository Credit Institutions | $ 10.81 | 5.78 | 1.87 | 7.86% | $ 0.05 |
| PSEC | Holding and Other Investment Offices | $ 10.86 | 8.83 | 1.23 | 12.17% | $ 0.11 |
| PNNT | Holding and Other Investment Offices | $ 10.87 | 8.36 | 1.30 | 10.30% | $ 0.28 |
| FSC | Non-Depository Credit Institutions | $ 10.94 | 10.62 | 1.03 | 10.51% | $ 0.10 |
| NCT | Holding and Other Investment Offices | $ 10.95 | 3.72 | 2.94 | 8.04% | $ 0.22 |
| SDR | $ 11.78 | 8.54 | 1.38 | 18.08% | $ 0.53 | |
| TWO | Holding and Other Investment Offices | $ 11.95 | 10.13 | 1.18 | 10.71% | $ 0.32 |
| CYS | Holding and Other Investment Offices | $ 12.11 | 4.59 | 2.64 | 10.57% | $ 0.32 |
| CMO | Holding and Other Investment Offices | $ 13.00 | 8.67 | 1.50 | 9.54% | $ 0.31 |
| ECT | Holding and Other Investment Offices | $ 13.50 | 5.44 | 2.48 | 20.21% | $ 0.68 |
| WHZ | $ 13.53 | 5.18 | 2.61 | 19.24% | $ 0.65 | |
| SDT | Oil and Gas Extraction | $ 13.69 | 4.58 | 2.99 | 19.01% | $ 0.65 |
| NYCB | $ 13.75 | 12.17 | 1.13 | 7.27% | $ 0.25 | |
| RNO | Coal Mining | $ 13.83 | 9.74 | 1.42 | 12.87% | $ 0.45 |
| PFLT | $ 13.97 | 8.96 | 1.56 | 7.52% | $ 0.09 | |
| HRZN | $ 14.18 | 10.06 | 1.41 | 9.73% | $ 0.12 | |
| NMM | Water Transportation | $ 14.39 | 8.94 | 1.61 | 12.30% | $ 0.44 |
| MAMTF | $ 14.55 | 11.84 | 1.23 | 8.38% | $ 0.31 | |
| MFCSF | $ 14.61 | 12.59 | 1.16 | 7.54% | $ 0.09 | |
| MCC | Industrial and Commercial Machinery and Computer Equipment | $ 14.70 | 10.58 | 1.39 | 9.80% | $ 0.36 |
| APSA | Real Estate | $ 14.75 | 14.60 | 1.01 | 12.29% | $ 0.91 |
| TCRD | $ 14.79 | 10.72 | 1.38 | 8.92% | $ 0.33 | |
| CHKR | Oil and Gas Extraction | $ 14.80 | 5.63 | 2.63 | 18.11% | $ 0.67 |
| PBI | Industrial and Commercial Machinery and Computer Equipment | $ 14.95 | 6.92 | 2.16 | 10.03% | $ 0.38 |
| TCPC | $ 15.18 | 12.55 | 1.21 | 7.91% | $ 0.40 | |
| NLY | Holding and Other Investment Offices | $ 15.87 | 9.28 | 1.71 | 11.34% | $ 0.45 |
| GBDC | $ 16.83 | 12.38 | 1.36 | 7.61% | $ 0.32 | |
| FNLIF | $ 17.36 | 9.79 | 1.77 | 7.91% | $ 0.11 | |
| ARI | Holding and Other Investment Offices | $ 17.50 | 10.67 | 1.64 | 9.14% | $ 0.40 |
| ARCC | Holding and Other Investment Offices | $ 17.60 | 7.96 | 2.21 | 8.64% | $ 0.38 |
| FDUS | $ 18.40 | 11.95 | 1.54 | 8.26% | $ 0.38 | |
| SUNS | $ 18.75 | 12.84 | 1.46 | 7.52% | $ 0.12 | |
| KKR | Security and Commodity Brokers, Dealers, Exchanges, and Services | $ 19.60 | 8.87 | 2.21 | 7.14% | $ 0.70 |
| IVR | $ 21.28 | 7.36 | 2.89 | 12.22% | $ 0.65 | |
| GSJK | Oil and Gas Extraction | $ 22.13 | 21.49 | 1.03 | 7.59% | $ 0.42 |
| AMTG | $ 22.23 | 2.66 | 8.36 | 12.60% | $ 0.70 | |
| MSB | Holding and Other Investment Offices | $ 22.49 | 9.18 | 2.45 | 8.71% | $ 0.49 |
| SFUN | Electronic and Other Electrical Equipment and Components, Except Computer Equipment | $ 22.57 | 12.20 | 1.85 | 8.68% | $ 0.98 |
| SLRC | $ 23.34 | 7.51 | 3.11 | 10.28% | $ 0.60 | |
| DMLP | Oil and Gas Extraction | $ 23.41 | 19.51 | 1.20 | 7.40% | $ 0.43 |
| MCEP | $ 23.80 | 14.69 | 1.62 | 8.32% | $ 0.50 | |
| NRP | Coal Mining | $ 24.06 | 12.21 | 1.97 | 9.14% | $ 0.55 |
| NRT | Holding and Other Investment Offices | $ 24.68 | 10.28 | 2.40 | 9.56% | $ 0.59 |
| EFC | Depository Institutions | $ 24.94 | 4.70 | 5.31 | 12.19% | $ 1.52 |
| MITT | Holding and Other Investment Offices | $ 25.15 | 3.50 | 7.18 | 12.72% | $ 0.80 |
| PSE | Oil and Gas Extraction | $ 25.35 | 8.45 | 3.00 | 8.21% | $ 0.52 |
| MTGE | Holding and Other Investment Offices | $ 25.96 | 2.92 | 8.90 | 13.87% | $ 0.90 |
| PMT | Holding and Other Investment Offices | $ 25.97 | 8.27 | 3.14 | 8.78% | $ 0.57 |
| BLIAF | $ 26.27 | 18.23 | 1.44 | 7.12% | $ 0.47 | |
| APO | Security and Commodity Brokers, Dealers, Exchanges, and Services | $ 26.41 | 12.82 | 2.06 | 15.90% | $ 1.05 |
| AI | Holding and Other Investment Offices | $ 26.71 | 1.43 | 18.73 | 13.10% | $ 0.88 |
| NTI | Paper and Allied Products | $ 27.00 | 19.57 | 1.38 | 18.81% | $ 1.27 |
| TCAP | Security and Commodity Brokers, Dealers, Exchanges, and Services | $ 27.51 | 12.74 | 2.16 | 7.85% | $ 0.54 |
| HTS | Holding and Other Investment Offices | $ 27.54 | 7.50 | 3.67 | 10.17% | $ 0.70 |
| LGCY | Oil and Gas Extraction | $ 27.95 | 19.96 | 1.40 | 8.16% | $ 0.57 |
| EEP | Pipelines, Except Natural Gas | $ 29.99 | 23.61 | 1.27 | 7.25% | $ 0.54 |
| BWP | Electric, Gas, and Sanitary Services | $ 30.25 | 22.08 | 1.37 | 7.04% | $ 0.53 |
| AGGZF | $ 32.58 | 23.61 | 1.38 | 7.16% | $ 0.19 | |
| RNF | Chemicals and Allied Products | $ 32.78 | 11.79 | 2.78 | 9.15% | $ 0.75 |
| AGNC | Holding and Other Investment Offices | $ 33.04 | 7.92 | 4.17 | 15.13% | $ 1.25 |
| SCCO | Metal Mining | $ 36.03 | 15.80 | 2.28 | 10.66% | $ 0.24 |
| WJXFF | $ 36.15 | 9.22 | 3.92 | 8.73% | $ 0.26 | |
| CLMT | Petroleum Refining and Related Industries | $ 37.10 | 10.60 | 3.50 | 7.01% | $ 0.65 |
| MMLP | Wholesale Trade-Non-Durable Goods | $ 39.02 | 29.56 | 1.32 | 7.89% | $ 0.77 |
| ETP | Electric, Gas, and Sanitary Services | $ 49.09 | 11.11 | 4.42 | 7.28% | $ 0.89 |
| SBR | Holding and Other Investment Offices | $ 50.55 | 14.08 | 3.59 | 10.46% | $ 0.44 |
| OAK | $ 51.89 | 13.55 | 3.83 | 8.09% | $ 1.05 | |
| GNI | Holding and Other Investment Offices | $ 67.10 | 5.02 | 13.38 | 13.41% | $ 2.25 |
| DHIL | Security and Commodity Brokers, Dealers, Exchanges, and Services | $ 75.17 | 13.82 | 5.44 | 10.64% | $ 8.00 |
| TNH | Chemicals and Allied Products | $ 199.99 | 11.72 | 17.06 | 7.26% | $ 3.63 |

Blog description

- Rodney
- A place for friends to gather and view stock market charts, discuss technical analysis and market outlook. What is your Principal Asset? How can it be developed? Each and all should do their own due dilligence and homework before investing. And by no means should you use anything I say or show here as a sole basis to buy or sell securities as everything is for educational experience only.
Saturday, April 13, 2013
Friday, March 22, 2013
WHX

Check out this consistent dividend payer. WHX has paid every quarter over last 5 years and the current yield is 37% for a $6 stock. Want to get started on that portfolio for $620 bucks, well here ya go. Buy it and forget it.
Created with ProphetCharts®
Sunday, March 17, 2013

AGNC - possible short

On a daily or weekly chart you may not catch this short possibility. However, on a Monthly chart you can see the "3 Black Crows" pattern breaking the trendline. After the pattern AGNC has failed to break back into the channel virtually moving sideways. I believe you can short here with a stop above $34 fairly safely.
Created with ProphetCharts®


DCIX - Bullish Engulfing pattern

Stop would be below previous day low 4.80
Created with ProphetCharts®

Friday, March 15, 2013


$SPX - Triple top

Do a Google search on "Triple Top". Self explanatory...
Created with ProphetCharts®

Tuesday, November 20, 2012


Tuesday, August 7, 2012
PT

The brown up arrows indicate when Dividend has been paid over last 10 years. Looks like almost every May and recent years in December as well.
Created with ProphetCharts®
Saturday, June 30, 2012
Saturday, May 19, 2012
AAPL

Buying all I can if under $500. Not completely sure it will get there.
Created with ProphetCharts®
GLD

Not sure how long ago I posted this pennant, but BUY now evn if you missed the limit order at 148.2.
Created with ProphetCharts®

Sunday, March 18, 2012
Crude continuous adjusted

Cheap relatively speakng...Ha A lot of overhead resistance but prone to severe spikes.
Created with ProphetCharts®


UNG

They must have issued more shares at erhaps 4 to 1 as I remember this being $5 a share. Still falling...
Created with ProphetCharts®
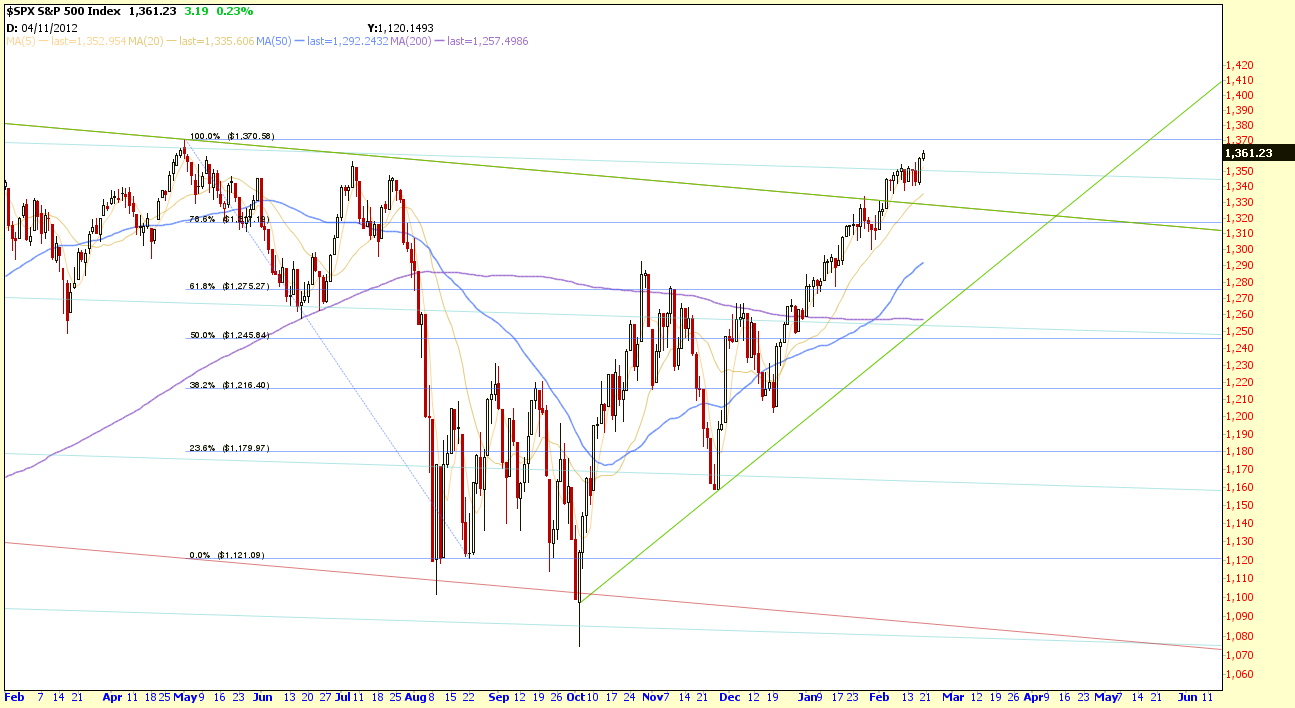
Friday, February 24, 2012
$VIX - 5yr weekly

Liking $30 call leaps. i'll get a quote and let you know...
Created with ProphetCharts®
$VIX - monthly all data

Fairly interesting parallel lines depicting levels of the VIX.
Created with ProphetCharts®


Saturday, February 18, 2012


Saturday, January 28, 2012


Thursday, January 19, 2012

Tuesday, January 10, 2012

Subscribe to:
Posts (Atom)