Blog description

My photo
A place for friends to gather and view stock market charts, discuss technical analysis and market outlook. What is your Principal Asset? How can it be developed? Each and all should do their own due dilligence and homework before investing. And by no means should you use anything I say or show here as a sole basis to buy or sell securities as everything is for educational experience only.

Sunday, March 17, 2013

NGD - Channel down Bullish


A less expensive way to ride the Gold rocket.


Created with ProphetCharts®

PETM - Channel down Bullish


Anatomy of a limping in with a purpose.


Created with ProphetCharts®

TNK - Bullish triangle pattern


Created with ProphetCharts®

DCIX - Bullish Engulfing pattern


Stop would be below previous day low 4.80


Created with ProphetCharts®

APA Falling Wedge


Bottom of channel - Bullish


Created with ProphetCharts®

Friday, March 15, 2013

BPZ - ready to launch


Breaking out above 2.68


Created with ProphetCharts®

MO - Triple Top @ 35


May want to protect your gains.


Created with ProphetCharts®

$VIX


Leap Puts should be getting cheaper as VIX tests all time lows.


Created with ProphetCharts®

$SPX - Triple top


Do a Google search on "Triple Top". Self explanatory...


Created with ProphetCharts®

PT


Looking to buy on gap fill at 5.26


Created with ProphetCharts®

Tuesday, November 20, 2012

SPY


Created with ProphetCharts®

MO - 10yr monthly


50 month EMA showing stong support and buy point.


Created with ProphetCharts®

Tuesday, August 7, 2012

PT


The brown up arrows indicate when Dividend has been paid over last 10 years. Looks like almost every May and recent years in December as well.


Created with ProphetCharts®

Saturday, June 30, 2012

Saturday, May 19, 2012

AAPL


Buying all I can if under $500. Not completely sure it will get there.


Created with ProphetCharts®

GLD


Not sure how long ago I posted this pennant, but BUY now evn if you missed the limit order at 148.2.


Created with ProphetCharts®

$SPX


WEAK. Wait for Bounce and trounce the puts or sell calls


Created with ProphetCharts®

Sunday, March 18, 2012

Crude continuous adjusted


Cheap relatively speakng...Ha A lot of overhead resistance but prone to severe spikes.


Created with ProphetCharts®

ARO


Topping tail - short


Created with ProphetCharts®

MO long term channels


Created with ProphetCharts®

$VIX


Options getting cheaper still


Created with ProphetCharts®

ABT


Created with ProphetCharts®

UNG


They must have issued more shares at erhaps 4 to 1 as I remember this being $5 a share. Still falling...


Created with ProphetCharts®

Friday, February 24, 2012

$VIX - 5yr weekly


Liking $30 call leaps. i'll get a quote and let you know...


Created with ProphetCharts®

$VIX - monthly all data


Fairly interesting parallel lines depicting levels of the VIX.


Created with ProphetCharts®

GMCR - weekly


Short


Created with ProphetCharts®

GLD - Weekly


HUGE pennant. Long above 160


Created with ProphetCharts®

$SPX - weekly


Careful...


Created with ProphetCharts®

MU - daily trend


Alert to Buy @ $7.29


Created with ProphetCharts®

MU - 5yr weekly


Created with ProphetCharts®

MO- 5yr weekly


May be wise to buy some 30 Puts


Created with ProphetCharts®

Saturday, February 18, 2012

MO - 2yr daily


Created with ProphetCharts®

MO


Created with ProphetCharts®

$SPX


Created with ProphetCharts®

Saturday, January 28, 2012

$SPX - 1yr daily


Be wary of the dump back to 1275


Created with ProphetCharts®

$SPX


Really?


Created with ProphetCharts®

Thursday, January 19, 2012

$SPX


A few more weeks of Pump...


Created with ProphetCharts®

Tuesday, January 10, 2012

$SPX


The huge inverted H&S about to top out by end of February.


Created with ProphetCharts®

Friday, November 18, 2011

Monday, November 14, 2011

SPY


Pivots & fibonacci's matching up closely makes for easy entry/exit points.


Thursday, November 10, 2011

$SPX


Long term inverted H&S pattern may be failing. Be careful with longs.


Wednesday, November 2, 2011

GLD


Still holding "toe" in Calls and will add more above 170.30


SPY


Gap fill Thursday or blood-bath on Friday. Green trendline holding as resistance.


Tuesday, November 1, 2011

SPY


A break of the 120.75 line will be a major support break of a Monthly Pivot. Tomorrow's action will be very important as a bull push back to the trendline and a gap fill at 125.33 between Wed and Thurs action. But look for the gap fill to be sold hard and this monthly pivot to be in play by Friday if not crushed depending on the news from Greece and Europe.


Monday, October 31, 2011

AAPL


MO


?


Reuters article on Yen versus Dollar implies 2 week tug-o-war till USA 11/23/11 deadline

SPY


Confounding fibonaccis.... 1 penny, really? I think it is pretty clear here a break of 125.33 and or the green trendline would be VERY bearish. I'm considering placing orders to get short below that and inching in long now with a TIGHT stop with thoughts of adding more long above 128.66.

Fun times.


Friday, October 21, 2011

SPY


Pennant Break


Tuesday, October 18, 2011

Evil Speculator says it best on today's action


Today was an OUTSIDE DAY.
What does that mean? In the simplest terms whenever I see an outside day (or an outside bar of any length) I think
OUTSIDE DAY = LONGS GOT FUCKED AND SHORTS GOT FUCKED
Think about it. Both sides got whipsawed out of their positions. What that means for us is that we have NEW PARTICIPANTS in the market. A trader who took a position today has a different expectancy and tolerance for pain than a long term trend trader, or someone who got in at the lows last week.
The latecomer into the long trade (and the short trade) is by definition a weak hand.
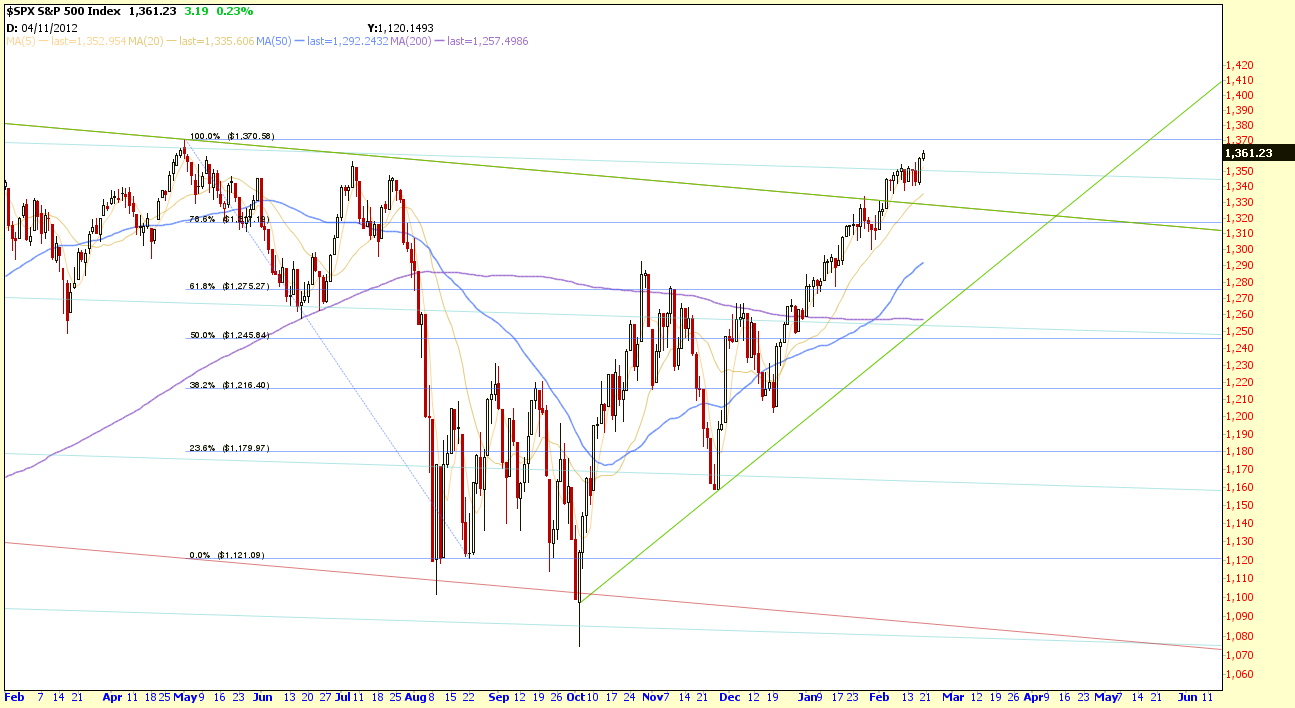
Anything not going his way is going to make him jump to the other side. We have shot to new highs for the last 2 months. Rather than predict whether this is a breakout or a test and fail… lets be objective and let the market tell us how it likes (or hates) these lofty heights.
We have a valid sell signal on break of the daily low, fakeout sell. However statistically outside days are often followed by inside days, before a final breakout. You might consider holding your fire here. Also, statistically outside days most often occur 2-3 days before a market turn.
And statistically setups at the top of a flat bollinger band are higher reliability.
What does this mean? Get out of longs for now, be prepared to get short… and if the short opportunity which almost certainly happens here fails, get long again.
"Late in the session, U.S. stocks and other risk assets received a boost from a Guardian report that Germany and France have agreed to expand the Eurozone bailout fund from 440 billion euros to 2 trillion euros, citing EU diplomats."


Really?  How many frickin' times can they play the same card?  Oh, I see they played all five at once this time by increasing the previous amount by 5 times.  Uhh, wouldn't that indicate that the problem is 5 times bigger?  Let's see if it gets done?