Blog description
- Rodney
- A place for friends to gather and view stock market charts, discuss technical analysis and market outlook. What is your Principal Asset? How can it be developed? Each and all should do their own due dilligence and homework before investing. And by no means should you use anything I say or show here as a sole basis to buy or sell securities as everything is for educational experience only.
Thursday, September 29, 2011
Tuesday, September 27, 2011
NFLX - PLUNGE
I vaguely recall someone (BRUNO) making this call in early July. I can only hope he actually traded on it and made some double coin in less than 3 months.
SPY - Bear/Bull tug-o-war
Well so far so good on the plan of shorting more about the green trendline. Today's action opened gapping up through the gap down of 9/22 but failed to penetrate the top side of the pennant. So BEAR FLAG still intact.
I'm not getting long until I see a print of 122.88 and those Call orders are already placed.
Monday, September 26, 2011
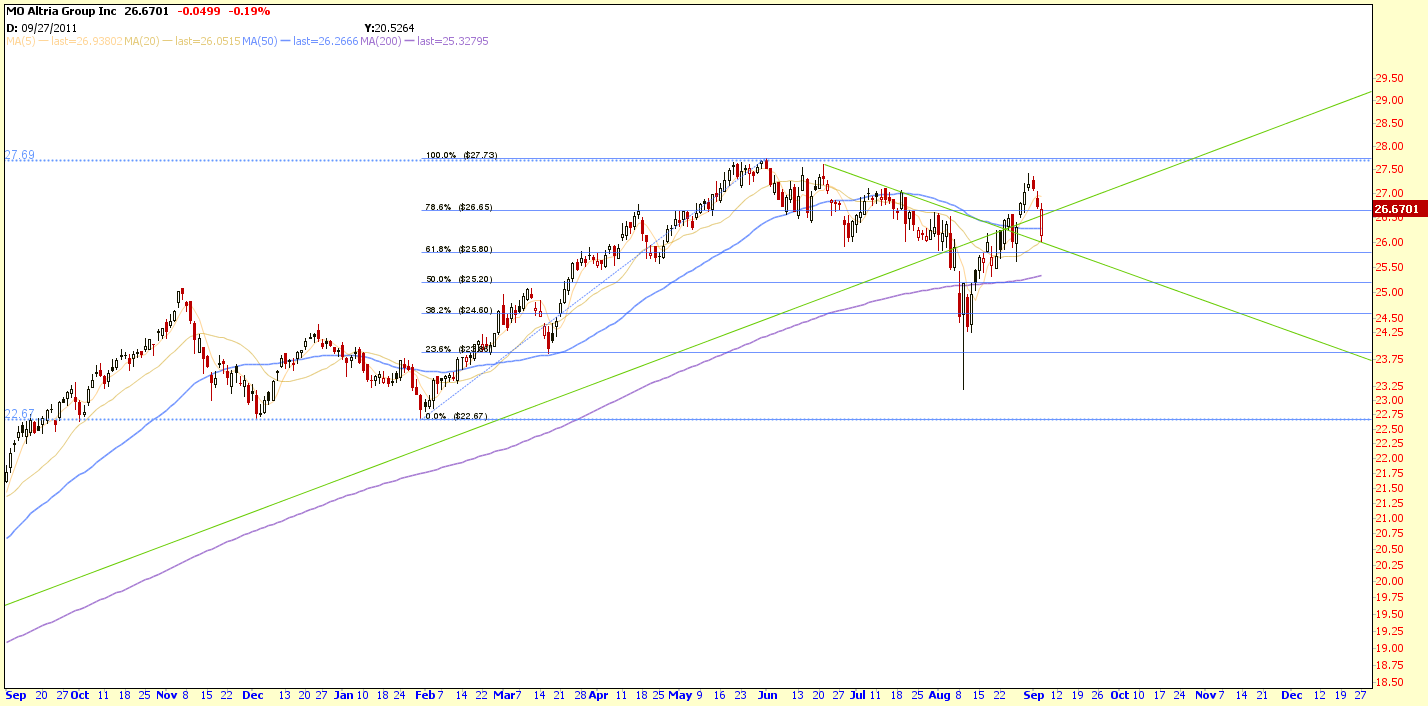
MO winthin .07 of Gap fill
Start nibbling on those PUTS to protect the Dividend yielding Monster shares. The green trendlines are the trading range.
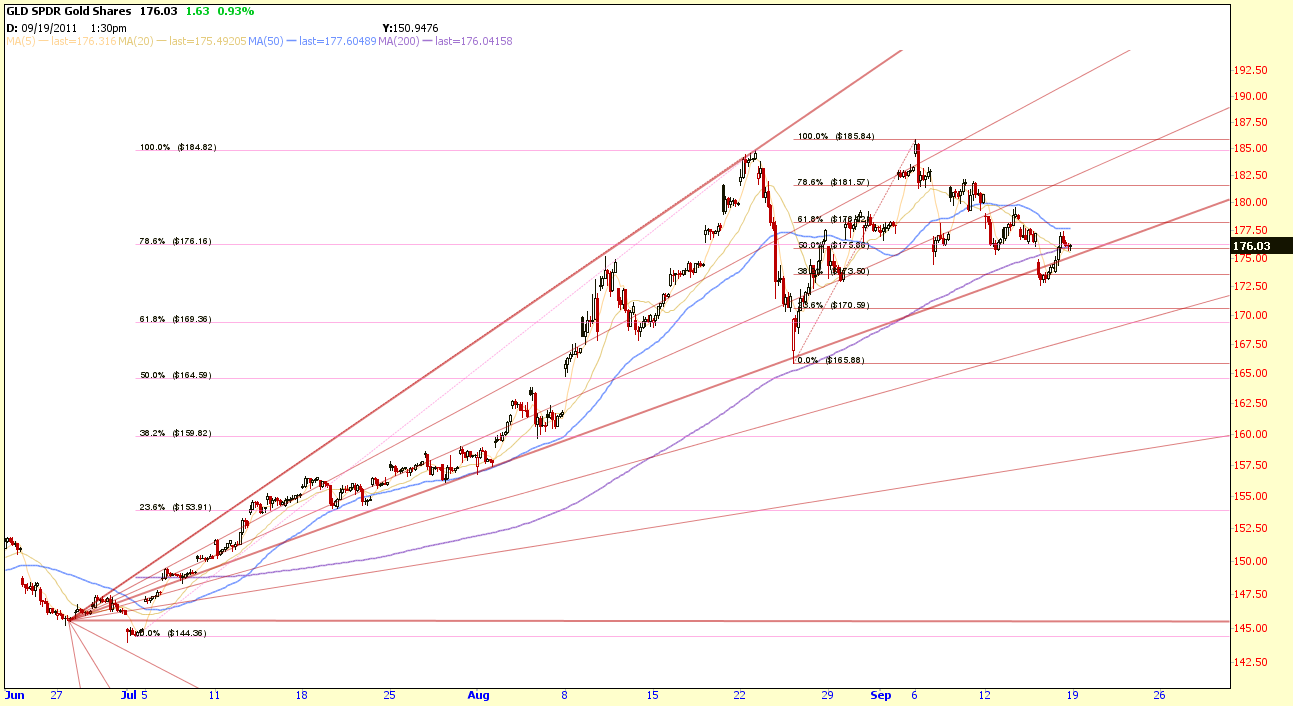
GLD
Bought a fewCalls at the open on a hunch and plan on setttin a trailing stop above 159.80 to lock the profits in.
SPY - Gap fill within .04
Momentum may carry higher to the underside of the green trendline. However, my Puts were filled and I'll double up if that happens.
Sunday, September 25, 2011
Football analogy to technical analysis provided by Stockcharts
Bulls Versus Bears
A candlestick depicts the battle between Bulls (buyers) and Bears (sellers) over a given period of time. An analogy to this battle can be made between two football teams, which we can also call the Bulls and the Bears. The bottom (intra-session low) of the candlestick represents a touchdown for the Bears and the top (intra-session high) a touchdown for the Bulls. The closer the close is to the high, the closer the Bulls are to a touchdown. The closer the close is to the low, the closer the Bears are to a touchdown. While there are many variations, I have narrowed the field to 6 types of games (or candlesticks):
- Long white candlesticks indicate that the Bulls controlled the ball (trading) for most of the game.
- Long black candlesticks indicate that the Bears controlled the ball (trading) for most of the game.
- Small candlesticks indicate that neither team could move the ball and prices finished about where they started.
- A long lower shadow indicates that the Bears controlled the ball for part of the game, but lost control by the end and the Bulls made an impressive comeback.
- A long upper shadow indicates that the Bulls controlled the ball for part of the game, but lost control by the end and the Bears made an impressive comeback.
- A long upper and lower shadow indicates that the both the Bears and the Bulls had their moments during the game, but neither could put the other away, resulting in a standoff.
Friday, September 23, 2011
SPY = Inside day
Friday's action was inside Thursday's High & low and subsequently somewhat of a non-event. Could fall from here next week or provide an awesome short opportuntity if the gap is filled back to 116.44.
Thursday, September 22, 2011
Wednesday, September 21, 2011
Saturday, September 17, 2011
Tuesday, September 13, 2011
Friday, September 9, 2011
EUR/USD - Ugly monthly
Easy to see the range from 1.31 to 1.40 for the next 14 months and why a break of 1.36 is so important.
SPY - box update 1pm
Nailed it. Rebound or breakdown to the close? My money is on hovering at these levels to the close and opening up on Monday to the top end - target 119.90. Either way I'm getting more short below 115.70 and getting more long above 120.
Thursday, September 8, 2011
SPY
Boxed in for big Pres. Obama speech on jobs. Jobs? Jobs? This stagnation recovery don't need no stinking jobs? Should be the best comedy on televison Thursday. Laughable.
Tuesday, September 6, 2011
Things U make $ on #3 - MO
Hmmmmm, 60 day 1 hr charts:
Lines & amp; SMA's -
Bounce but still weak; break inevitable- A LONG way to fall-
Thursday, August 25, 2011
Wednesday, August 24, 2011
SO
What's the story here...gravity defiance in the electrical services field?
$0.47 Dividend
4.58% Dividend yield
17.47 PE
2.36 EPS
GLD
A Parable from the Bible - Luke 19:11-28
Basically a master gives to his servants equal amounts of gold and two of them use their gold to create value while the other one buries it. The one that buries it has it taken away and the ones who invest it wisely are given more. To him who has, more will be given. To him who has not, even that which he has will be taken away.
Tuesday, August 23, 2011
Monday, August 22, 2011
Population pondering...
I was wondering if other countries had age demographic issues like the baby boomers of the USA and globally where the USA stood population growth wise along a time line into the next several years. Interestingly enough I was surprised to find what I thought was/is a severe issue in America is even more prevalent in Europe and China as time lingers to 2050. Bottom-line is: How will healthcare GLOBALLY be paid for as the population lives longer and ages?
Animation link:
Friday, August 19, 2011
MU - 5yr wekly
Updated Monthly & Weekly Pivots for a tiered entry. Any break above the greeen trend would signal BUY.
Thursday, August 18, 2011
MU - 5yr weekly
Improtant levels:
Daily S3 pivot = 5.38
Monthly S2 pivot = 5.38
38.2% Fibonacci = 5.55
23.6% Fibonacci = 4.03
Subscribe to:
Posts (Atom)