Blog description
- Rodney
- A place for friends to gather and view stock market charts, discuss technical analysis and market outlook. What is your Principal Asset? How can it be developed? Each and all should do their own due dilligence and homework before investing. And by no means should you use anything I say or show here as a sole basis to buy or sell securities as everything is for educational experience only.
Thursday, December 2, 2010
Saturday, November 27, 2010
Friday, November 12, 2010
Thursday, November 4, 2010
Wednesday, October 13, 2010
Thursday, September 30, 2010
Friday, September 17, 2010
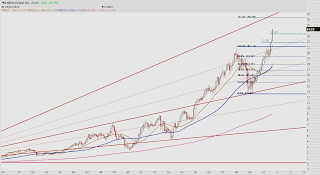
RIMM - Out of fashion play short
Looking to short Rimm with Leaps
Stop $48
or doubling up at $52.25
For the Web's best interactive charts, please visit http://www.Prophet.Net
Wednesday, September 8, 2010
$SPX
Flag on the minute chart = short-term bullish
For the Web's best interactive charts, please visit http://www.Prophet.Net
Friday, September 3, 2010
$SPX
As if this was a surprise to any technical analyst.
For the Web's best interactive charts, please visit http://www.Prophet.Net
Tuesday, August 31, 2010
Monday, August 30, 2010
Friday, August 27, 2010
UNG - Getting Less expensive
Thinking about picking up some Leap Calls on Natural Gas in the next six months. Downside risk below $6 is minimal.
For the Web's best interactive charts, please visit http://www.Prophet.Net
Wednesday, August 25, 2010
$TNX - 10 year note
Sooner or later there will be no reason for China to buy the US debt. When that happens - game over
For the Web's best interactive charts, please visit http://www.Prophet.Net
TLT
Treasuries flying toward top.
For the Web's best interactive charts, please visit http://www.Prophet.Net
Tuesday, August 24, 2010
BHI - monthly
Bear Flag or Bull flag? Each a year long, but the BEAR is BIGGER.
Two ways to trade:
Get short with a stop above $49
or
Get long with a stop below $37.75
If you choose the long side it may pay to take any profit quickly.
Monday, August 23, 2010
Tuesday, August 17, 2010
$SPX - trading range
Trading range for 4-6 weeks
For the Web's best interactive charts, please visit http://www.Prophet.Net
GD - Ken Fischer
General Dynamics - is a government play on a defense contractor. A 2.6% Dividend yield beats putting your money in low yielding bonds. There is still time to pick your spots here as governmental policy won't shift until the next Presidential election.
Looks to me like the Fib fans give some nice points to set alerts:
Short above $70
1/3 Long below $60
1/3 Long below $ 47
1/3 Long below $40
For the Web's best interactive charts, please visit http://www.Prophet.Net
FMS - Ken Fischer
Fresenius Medical Care - runs 2500 dialysis and supplies equipment to other treatment facilities.
For the Web's best interactive charts, please visit http://www.Prophet.Net
Ken Fischer - SEOAY
Europe;s largest paper packaging and forest procducts company is sensitive to the home construction and news print business performance.
For the Web's best interactive charts, please visit http://www.Prophet.Net
CPL - Ken Fischer pick
Brazilian Energy corp with a 6% dividend yield
For the Web's best interactive charts, please visit http://www.Prophet.Net
Monday, August 16, 2010
MO
20 year monthly fibonacci fan suggests short term top.
For the Web's best interactive charts, please visit http://www.Prophet.Net
Friday, August 13, 2010
IWM
Blue - Inverted left shoulder
Pink - Inverted Head
Green - Inverted right shoulder or Smaller H&S pattern topping latest bull run from head? Which will prevail? Normaly it is the longer time frame or larger pattern that prevails; however if the larger pattern fails it will be a violent failure.
Bottom line:
Long above - $59
Short now with stop of 50 week SMA at $63
For the Web's best interactive charts, please visit http://www.Prophet.Net
Subscribe to:
Comments (Atom)


